| 来源类型 | Book/Report |
| 规范类型 | 报告 |
| Know Your Oil: Creating a Global Oil-Climate Index | |
| Deborah Gordon; Adam Brandt; Joule Bergerson; Jonathan Koomey | |
| 发表日期 | 2015-03-11 |
| 出版年 | 2015 |
| 语种 | 英语 |
| 概述 | Oil is changing. Conventional oil resources are dwindling as tight oil, oil sands, heavy oils, and others emerge. |
| 摘要 | Oil is changing. Conventional oil resources are dwindling as tight oil, oil sands, heavy oils, and others emerge. Technological advances mean that these unconventional hydrocarbon deposits in once-unreachable areas are now viable resources. Meanwhile, scientific evidence is mounting that climate change is occurring, but the climate impacts of these new oils are not well understood. The Carnegie Endowment’s Energy and Climate Program, Stanford University, and the University of Calgary have developed a first-of-its-kind Oil-Climate Index (OCI) to compare these resources. All Oils Are Not Created Equal
Next Steps for the OCI
IntroductionThe character of oil is changing. Consumers may not notice the transformation—prices have fluctuated, but little else appears to have changed at the gas pump. Behind the scenes, though, the definition of oil is shifting in substantial ways. There is oil trapped tightly in shale rock, and oil pooled many miles below the oceans. Oil can be found in boreal forests, Arctic permafrost, and isolated geologic formations. Some oils are as thick as molasses or as gummy as tar, while others are solid or contain vastly more water or gas than normal. As oil is changing, so, too, is the global climate. Oil resources were once fairly homogeneous, produced using conventional means and refined into a limited number of end products by relatively simple methods. This is no longer the case. Advancements in technology mean that a wider array of hydrocarbon deposits in once-unreachable areas are now viable, extractable resources. And the techniques to turn these unconventional oils into petroleum products are becoming increasingly complex. As oil is changing, so, too, is the global climate. The year 2014 ranked as the earth’s warmest since 1880. Fossil fuels—oil along with coal and methane gas—are the major culprits. The only way to determine the climate impacts of these previously untapped resources—and to compare how they stack up against one another—is to assess their greenhouse gas (GHG) emissions at each stage in the oil supply chain: exploration, extraction, processing, refining, transport, and end use. The more energy it takes to carry out these processes, the greater the impact on the climate. And in the extreme case of some of these oils, it may take nearly as much energy to produce, refine, and transport them as they provide to consumers. Moreover, each oil yields a different slate of petroleum products with different combustion characteristics and climate footprints. The Oil-Climate Index (OCI) is a metric that takes into account the total life-cycle GHG emissions of individual oils—from upstream extraction to midstream refining to downstream end use. It offers a powerful, yet user-friendly, tool that allows investors, policymakers, industry, the public, and other stakeholders to compare crudes and assess their climate consequences both before development decisions are made as well as once operations are in progress. The Oil-Climate Index will also inform oil and climate policy making. The index highlights two central facts: The fate of the entire oil barrel is critical to understanding and designing policies that reduce a crude oil’s climate impacts. And oils’ different climate impacts are not currently identified or priced into the market value of competing crudes or their petroleum products. As such, different oils may in fact entail very different carbon risks for resource owners or developers. Different oils may entail very different carbon risks for resource owners or developers. Analysis of the first 30 test oils to be modeled with the index reveals that emission differences between oils are far greater than currently acknowledged. Wide emission ranges exist whether values are calculated per barrel of crude, per megajoule of products, or per dollar value of products, and it is expected that these emission ranges could grow as new, unconventional oils are identified. There are several critical variables that lead to these variations in oils’ life-cycle climate emissions. They include how gas trapped with the oil is handled by producers, whether significant steam is required for oil production, if a lot of water is present as the oil reservoir depletes, how heavy (viscous) or deep the oil is, what type of refinery is used, and whether bottom-of-the-barrel products like petroleum coke (known as petcoke) are combusted. Given these factors, the most climate-intensive oils currently identified—gassy oils, heavy oils, watery and depleted oils, and extreme oils—require special attention from investors, operators, and policymakers. Expanding the index to include more global oils is necessary in order to compare greater volumes of crudes. This requires more transparent, high-quality, consistent, accessible, open-source data. As competition mounts between new oils, information about emerging resources is needed to increase market efficiency, expand choices, leverage opportunities, and address climate challenges.
Oil 2.0Concerns about oil scarcity beset the world for nearly half a century, but that may no longer be the overriding worry. Larger questions loom about the changing nature of oil resources, their unknown characteristics, their climate and other environmental impacts, and policies to safely guide their development and use. Advancements in technology that have unlocked unconventional hydrocarbon deposits in onceunreachable areas are costly and risky in both private and social terms. Indeed, there are thousands of oils available globally for production and use. The earth is stocked with a surfeit of hydrocarbons. As of 2013, there are an estimated 24 trillion barrels of oil in place, of which 6 trillion barrels are deemed technologically recoverable. These resources take different forms—from rocky kerogen to sludgy tar to volatile gassy liquids. They exist under vastly different conditions: deep and shallow; onshore and offshore; pooled and dispersed; and in deserts, permafrost, rainforests, and grasslands. An evolving array of techniques must be employed to transform them into a myriad of petroleum products, some more valuable than others, which flow in all directions to every economic sector and most household products. Advancements in technology that have unlocked unconventional hydrocarbon deposits in once-unreachable areas are costly and risky in both private and social terms. Many of these advancements result in larger GHG emissions than traditional extraction methods, and some oils have more than 80 percent higher emissions per barrel than others (see figure 1).
Consider a few examples. For California’s Midway Sunset oil field, a sizable portion of the oil’s own energy content is used before any of the petroleum products the field ultimately provides reach consumers. This century-old oil field requires large volumes of steam to be injected into the reservoir to loosen the oil and allow it to flow. Generating this steam requires up to one-third of the energy content of the oil itself, in the form of natural gas. The water content of this oil is high and therefore takes extra energy to lift. Much of its oil is very heavy and requires energy-intensive, complex refining techniques. The combination of energy used in extraction and refining means almost half of Midway Sunset’s total greenhouse gas emissions are released before the resource even gets to market. Other oils, such as Norway Ekofisk, fare much better in these regards. This light oil is more easily produced. Extraction operations are tightly regulated by the Norwegian government; as such, the gas produced with the oil is gathered and sold instead of burned (or flared) on-site and wasted. Ekofisk oil is processed by the simplest hydroskimming refinery, and less than 10 percent of its greenhouse gases are emitted before it gets to market. Oil markets, meanwhile, are durable given the lack of ready substitutes. Oil consumption has marched steadily upward, from 77 million barrels per day (mbd) in 2000 to 92 mbd in 2014, despite a major global economic downturn. Oil dominates the transportation sector, providing 93 percent of motorized transportation energy. Overall, the oil sector is responsible for a reported 35 percent of global GHG emissions. All actors would be better served by accurate, transparent measures of climate risk associated with different oils. Parsing oils by their climate impacts allows multiple stakeholders, each with their own objectives, to consider climate risks in prioritizing the development of future oils and the adoption of greater policy oversight of today’s oils. While objectives of stakeholders may vary (for example, environmental nongovernmental organizations may have different perspectives than investors), all actors would be better served by accurate, transparent measures of climate risk associated with different oils. The Most Challenging OilsEven with the decline in oil prices that began in August 2014, there remains fierce competition between diverse global oils. A few of them are more challenging in terms of climate change than others.
Whether global oil production returns to record levels, wanes, or fluctuates in the future, there is little doubt that oils will be increasingly unconventional. And there is little doubt that oil extraction, refining, and consumption should be better understood. There is far too little information about the new generation of oil resources. There is far too little information about the new generation of oil resources. Creating an Oil-Climate IndexAs the changing climate results in higher social costs, the environmental limitations on oil production and consumption will have more significant effects than the industry has heretofore acknowledged.1 Recent research has shown that to keep the earth from warming more than 2 degrees Celsius from preindustrial times—the limit set in the 2009 Copenhagen Accord as the threshold for “dangerous” human interference in the climate system—at least one-third of the world’s oil reserves should not be burned or the carbon from refined oil products’ combustion should be safely stored.2 Investors and companies facing such constraints will need data on the total life-cycle emissions from the exploration, extraction, transportation, refining, and combustion of oil resources, data that do not now exist, at least not in a consistent, transparent, and peer-reviewed way. The Oil-Climate Index is designed to fill that void by analyzing total GHG emissions (including all co-products) for given crudes using three different functional units, or different metrics, for comparison. The first version of the index includes: emissions per barrel of crude produced, emissions per energy content of all final petroleum products, and emissions per dollar value of all petroleum products sold. The Oil-Climate Index uses the following open-source tools to evaluate actual emissions associated with an individual oil’s supply chain:
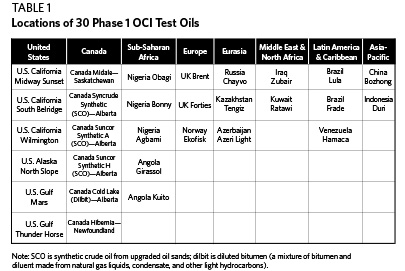
While oil type, production specifications, and geography were initial factors in selecting oils to model in Phase 1 of the Oil-Climate Index, data availability turned out to be the overriding factor. The oils modeled in the first phase are found around the world (see table 1). Oils were analyzed across the entire value chain—the series of transformations and movements from an oil’s origin to the consumption of the slate of petroleum products it yields.
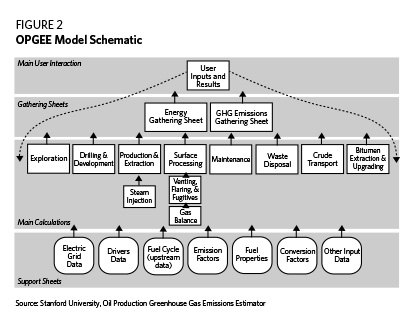
Modeling Upstream Oil EmissionsUnearthing oil and preparing it for transport to a refinery is the first step in the value chain. The processes involved differ from oil to oil. Together, exploration, production, surface processing, and transport of crude oil to the refinery inlet comprise upstream operations, and the resulting GHG emissions are modeled in OPGEE (see figure 2).
OPGEE Phase 1 ResultsCrudes vary significantly in their upstream GHG impacts. To date, OPGEE has been run on approximately 300 global crudes, many of which are in California and Canada. This represents more upstream crude runs than any other modeling effort, including the National Energy Technology Laboratory’s Development of Baseline Data and Analysis of Life Cycle Greenhouse Gas Emissions of Petroleum-Based Fuels (twelve crudes in November 2008); the Jacobs Consultancy’s Life Cycle Assessment Comparison of North American and Imported Crudes (thirteen crudes in 2009); TIAX Consulting’s Comparison of North American and Imported Crude Oil Lifecycle GHG Emissions (nine crudes in 2009); and IHS Consulting’s Comparing GHG Intensity of the Oil Sands and the Average U.S. Crude Oil (28 crudes in 2014). For the purposes of the Oil-Climate Index, it was critical that data were available to simultaneously model both upstream and midstream emissions. This narrowed the field down to 30 OCI test oils for the first phase. There is large variation in upstream emissions across the 30 test oils. The oil with the highest emissions intensity has approximately twelve times the emissions of the lowest-intensity oil (see figure 3).
What Drives Upstream Emissions?The emissions from different oils have different origins. UK Brent, for example, emits most of its GHG emissions during surface processing, while California South Belridge emits more due to the steam used during production (see figure 4). Other upstream emissions drivers include the gas produced with the oil that may be flared or vented, depending on local conditions. Oil location—including geography and ecosystem (such as desert, Arctic, jungle, forest, and offshore)—determines how disruptive extraction is to land use. When oil development activities change land use, this affects the land’s biological (soil and plants) carbon storage capacity. The more naturally stored carbon that is released, the more greenhouse gases are emitted. An oil field’s location, its distance to transport hubs, and refinery selection determine the method that is used to move the resource and the resulting transport emissions. Pipelines, railroads, or trucks are used to ship the oil overland. Barges move oil over inland waterways, and seaborne crude shipments rely on marine tankers. In the first phase of the Oil-Climate Index, it was assumed as a default that all crude is sent to the city of Houston in Texas. As of January 2014, the U.S. states of Texas and Louisiana had more refining capacity than any nation, including China and Russia.5
OPGEE analysis points to a number of factors that result in particularly high upstream emissions:
OPGEE ChallengesThe largest source of uncertainty in OPGEE is the lack of information on global oil fields. Many operators and many regions of the world have few formal data publication requirements. Data quality is also an ongoing issue in modeling upstream emissions (see the appendix for details). OPGEE utilizes about 50 data inputs, from simple entries like the name of the country where an oil field is located to challenging-to-obtain information such as an oil field’s productivity index (expressed in daily production per unit pressure). Substantial research is involved in gathering OPGEE modeling data, which can be obtained from agencies, reports, scientific literature, and industry references. OPGEE can function with limited data. The model has a comprehensive set of defaults and smart defaults that can fill in missing data. The more data found for a particular field, the more specific and less generic the emissions estimate becomes. All data are used to determine smarter default values over time. As with all life-cycle assessment (LCA) models, boundaries must be drawn around the analysis. The handling of co-products that cross boundaries along the oil supply chain, from extraction to refining to end use, presents methodological challenges. For example, resulting GHG emissions from condensates of light liquids, like ethane, that can be stripped off and sold before oil is transported to a refinery are not expressly included in OPGEE. Emissions associated with exploration occur at the beginning of an oil field development project and are spread over the life of the field. Extraction emissions that occur routinely are estimated at a point in time and assumed to recur over the lifetime of the oil field. OPGEE treats liquid petroleum as the principal product of upstream processes. Emissions associated with electricity generated on-site or natural gas produced that is gathered, sold, and not flared is credited back or deducted from total emissions in OPGEE accounting (see figure 4 above).6 Any emissions from co-products like petcoke that are associated with upgrading heavy oils upstream of the refinery—as can be the case with Canadian bitumen and Venezuelan heavy oils—are not included in OPGEE unless the production process directly consumes petcoke (as in some oil-sands-based integrated mining and upgrading operations). Emissions from net production of petcoke have been included in the OPEM downstream combustion module. Recent studies have found that uncertainty in OPGEE’s results is reduced after learning three to four key pieces of data about an oil field.7 After learning the ten most important pieces of information about an oil field, there is typically little benefit to learning the remaining data. Imprecise data reporting introduces additional uncertainty. Errors in applying the model can lead to further uncertainty. The key variables to enhance model precision include: steam-to-oil and water-to-oil ratios, flaring rates, and crude density (measured as API gravity). Less important variables in the OPGEE model’s ability to analyze GHG emissions include gas-to-oil ratios, oil production rates, and depth (except in extreme cases). Modeling Midstream Oil EmissionsRefineries are akin to a professional chef’s kitchen. Instead of edible organic foodstuff, the ingredients are hydrogen, carbon, oxygen, and a multitude of impurities. Refinery equipment—effectively the stoves, refrigerators, pressure cookers, mixers, and bowls—heats, cleaves, blends, and reconfigures the massive flows of hydrocarbons it is fed. Refining used to be a relatively simple process that involved applying heat to boil oil and separating it into its main components. But the changing nature of oil demands changes in refineries. The changing nature of oil demands changes in refineries. PRELIM is the first open-source refinery model that estimates energy and GHG emissions associated with various crudes processed in different refinery types using different processing equipment. It provides a more detailed investigation into the impacts crude quality and refinery configurations have on energy use and GHG emissions than what has been presented in the public realm to date. PRELIM can run a single crude or a blend of oils, and when combined with OPGEE, the model provides the second of the three components in the improved oil life-cycle assessment. PRELIM influences the Oil-Climate Index in two important ways. It estimates midstream GHG emissions, and it predicts what petroleum commodities the refinery produces. The type and amount of products vary with a refinery’s design. Matching Oils to RefineriesEvery refinery is unique in terms of the combination of equipment it uses, the blends of crudes it is optimized for, and ultimately the type and amount of products it sells. Matching oil characteristics with refining infrastructure in order to meet end-use product demand is the midstream goal. PRELIM attempts to represent many of these possible refinery configurations by including three different types of refinery—hydroskimming, medium conversion, or deep conversion—and ten combinations of processing units within refinery categories (see figure 5). One configuration, for example, employs a coking unit in a deep conversion refinery to reject high levels of carbon in the form of petcoke. Another example is configuring a refinery with hydrotreating for adding hydrogen.
The inputs and outputs of each refinery process unit are estimated using characteristics about individual process units from existing literature and industry-expert input as well as characteristics of the crude or crude blend. Technically, each crude can be blended and processed in many different refinery configurations, but in practice crude oils are best matched to certain configurations. PRELIM selects the default refinery configuration that best suits a crude oil based on its properties (API gravity and sulfur content). This means that light and sweet (low sulfur) crudes will be processed in simpler refineries and heavy and sour (high sulfur) crudes will be directed to complex deep conversion refineries. Specifically, PRELIM matches refineries with crudes as follows:
While API gravity and sulfur are good indicators of a default refinery type, they are not sufficient to determine refinery GHG emissions. Th |
| URL | https://carnegieendowment.org/2015/03/11/know-your-oil-creating-global-oil-climate-index-pub-59285 |
| 来源智库 | Carnegie Endowment for International Peace (United States) |
| 资源类型 | 智库出版物 |
| 条目标识符 | http://119.78.100.153/handle/2XGU8XDN/416807 |
| 推荐引用方式 GB/T 7714 | Deborah Gordon,Adam Brandt,Joule Bergerson,et al. Know Your Oil: Creating a Global Oil-Climate Index. 2015. |
| 条目包含的文件 | ||||||
| 文件名称/大小 | 资源类型 | 版本类型 | 开放类型 | 使用许可 | ||
| know_your_oil-1.jpg(14KB) | 智库出版物 | 限制开放 | CC BY-NC-SA |  浏览 | ||
| 文件名: | know_your_oil-1.jpg |
| 格式: | JPEG |
除非特别说明,本系统中所有内容都受版权保护,并保留所有权利。