| 来源类型 | ISSUE BRIEF |
| 规范类型 | 简报 |
| The Reality of the Retirement Crisis | |
| Keith Miller; David Madland; Christian E. Weller | |
| 发表日期 | 2015-01-26 |
| 出版年 | 2015 |
| 语种 | 英语 |
| 概述 | For millions of Americans, retirement—the so-called golden years—will be significantly tarnished by a lack of savings. |
| 摘要 | When reviewing the data on how American workers are saving for retirement, two facts become abundantly clear:
The consequences of these growing savings shortfalls could be severe for both American families and the national economy, as a large share of households may be forced to significantly reduce consumption in retirement and will have to rely heavily on their families, charities, and the government for help to make ends meet. Rather than staying in control of their economic lives, millions of Americans may be forced to muddle through their final years partially dependent on others for financial support and to accept a standard of living significantly below that which they had envisioned. This issue brief will illustrate the reality of this crisis by first looking at what the data have to say about how much money Americans are putting away for retirement. It will then evaluate the results of studies that use complex modeling to estimate what percentage of the population is at risk of falling short of achieving a financially stable retirement. What is made clear is that no matter how households’ needs in retirement are projected or how their incomes, assets, and debts are measured, an unacceptably large share of Americans appears at risk of being forced into a lower standard of living in retirement. The most convincing estimates of the share of households who will have insufficient assets stand at slightly more than 50 percent. But even more sobering is the fact that the most optimistic studies still find that nearly one-quarter of retirees are falling short. Facts on the crisisThe data available on how American households build up financial assets and how they have done so over time show an American public that is struggling to prepare itself for retirement and that is becoming less well prepared over time. Three clear trends in particular illustrate to what extent Americans are underprepared for retirement. A large percentage of Americans are saving nothing for retirementAccording to a recently released household survey conducted by the Board of Governors of the Federal Reserve System, as of 2013, approximately 31 percent of Americans reported having zero retirement savings and lacking a defined-benefit, or DB, pension. This finding is in keeping with the results of other comprehensive Federal Reserve surveys and means that nearly one-third of people in the United States currently have no money put away in any type of retirement account to supplement their Social Security benefits. Among respondents ages 55 to 64—those nearest to retirement who already should have built up significant savings—the share who reported having no savings or pension was still 19 percent, or approximately one out of every five near-retirement households. 
That such a large share of Americans lacks any savings should not be particularly surprising given that so many still lack access to the primary savings vehicles used by workers today: workplace retirement plans. As of 2014, only 65 percent of private-sector workers had access to a retirement plan through their jobs, and only 48 percent participated in one. Even when looking just at full-time workers, more than one-quarter still lacked access to an employer-sponsored retirement plan, and more than 40 percent did not participate in one. Moreover, these numbers have not been getting significantly better over time. In fact, studies that use data that allow for long-term analysis indicate that the share of private-sector workers with access to workplace plans is actually lower now than it was in the late 1980s. Families that are saving often have insufficient assetsAs traditional DB pensions become increasingly rare, it is more important for workers to build up savings in defined-contribution, or DC, plans such as 401(k)s or in nonemployer-based individual retirement accounts, or IRAs. Unfortunately, most households have failed to build up anywhere near enough in these accounts. As of 2013, the median retirement account balance among all households ages 55 to 64 was only $14,500. Even after excluding all households that had saved nothing, the median account balance of near-retirement households was still only $104,000. If a household uses all of this money to purchase an annuity from a life insurance company that will pay a guaranteed monthly income for the rest of the household’s life, this income will provide only approximately $5,000 per year in retirement—nowhere near what the household is likely to need.
These facts may seem somewhat confusing to those who know that the aggregate sum of savings in such plans has grown significantly over time and is indeed quite large, at more than $12.1 trillion in 2013. While this is an impressive sum, the distribution of these assets across households results in typical middle-class households having very low savings in their accounts. Simply put, the wealthy hold most of these assets, while the middle class and the poor have comparatively little. As of 2013, the top 20 percent of working-age households by income owned 67.7 percent of all retirement account assets, while the bottom 50 percent owned only 7.4 percent. Among older households, a study for the Social Security Administration found that only 19 percent of families headed by a person over age 65 were actually receiving distributions from a retirement account as of 2009, with only 8 percent of families in the bottom income quartile receiving any such distributions. Households today should increase their savings relative to prior generations but they are not doing soOne simple way to measure how capable households will be of maintaining their standard of living in retirement is to look at the ratio of their total wealth to their income. This gives an idea of how much in total assets a family has built up relative to approximately how much they consume in a given year. As data from the Survey of Consumer Finances, or SCF, make clear, while these ratios did improve for older households during the 1990s and early 2000s—when the housing bubble was growing and stock markets were booming—they subsequently collapsed following the Great Recession and have shown no signs of recovering. All told, households near retirement age were worse off in 2013 than they were in 1989. Meanwhile, ratios for younger households showed almost no significant growth even when the economy was doing well during the late 1990s and early 2000s, and they have since fallen off significantly in recent years as well. This means that today, households across all age groups have wealth-to-income ratios that are effectively unchanged from or significantly below the ratios achieved by households in previous decades. This is particularly worrisome given that during this time period, workers increasingly shifted away from DB pension plans—the assets of which are not measured by the SCF—to DC plans, the assets of which are measured. Even if households in more recent years built up the same amount of assets as households in previous years, the shift from DB to DC pension plans should have resulted in wealth-to-income ratios rising as the amount of unreported assets decreased.
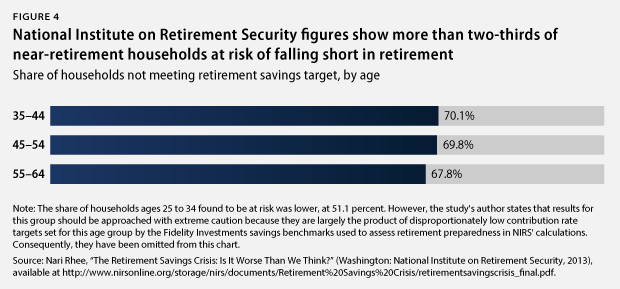
This stagnation of wealth-to-income ratios might be fine if retirement needs had stayed the same over time, but as Alicia H. Munnell of the Center for Retirement Research at Boston College, or CRR, has previously explained in great detail, retirement needs have actually grown significantly in recent decades. Life expectancy has increased and the retirement age for full Social Security benefits has risen to age 67, meaning workers now have more years of expenses to cover but must wait longer to begin receiving full Social Security benefits. Health care costs also have risen substantially, resulting in higher expenditures for retirees, and the decline in real interest rates since 1983 means that a given amount of wealth accumulated today now produces less retirement income than it would have in previous decades. For all of these reasons, workers should be approaching retirement with greater wealth relative to their income than did previous generations. The data, however, show the opposite is occurring, indicating that current workers are not as prepared for retirement and that increasing shares of younger generations may be forced to muddle through their retirements by continuing to work beyond when they intended, by relying on family and government programs for aid, or by significantly cutting back on their consumption. How do all of these facts fit together?All of these facts indicate that millions of American families are facing the very real prospect of not being able to maintain their standard of living in retirement and that the problem is growing worse over time. However, researchers and policymakers often want to provide a single number that quantifies exactly what share of Americans are at risk of having insufficient savings. Arriving at such a number requires the use of complex modeling, but it can be done. A number of such analyses have been conducted in recent years, producing different estimates. The differences are primarily due to the differing assumptions built into each model and the ways in which some key variables are measured. (see the Appendix for additional details) This section looks at some of the most widely cited studies, including some of the most pessimistic and most optimistic, and describes what they show about the depth of the retirement crisis. What is clear from all of these analyses, however, is that no matter what assumptions or measures are used, an unacceptably large percent of Americans are at risk of having to decrease their standard of living in retirement, and the problem is only getting worse over time. The pessimistic assessmentsOne of the most frequently cited examples of the more pessimistic estimates of Americans’ retirement preparedness comes from the National Institute on Retirement Security, or NIRS, in its report “The Retirement Savings Crisis: Is It Worse Than We Think?” This report uses industry recommended savings guidelines from the brokerage firm Fidelity Investments to assess what share of households are on track to hit an income replacement rate target—that is, the share of a household’s preretirement income that it needs to replace in retirement to maintain its standard of living—of 85 percent. When assessing households’ readiness using the broadest measure of household resources—net worth—the report found that 65 percent of households between ages 25 and 64 were at risk of not meeting their retirement savings target as of 2010. Notably, the share deemed to be at risk increases as households become younger, growing from 67.8 percent of those ages 55 to 64, to 69.8 percent of those ages 45 to 54, to 70.1 percent of those ages 35 to 44. It then falls significantly to 51.1 percent of households ages 25 to 34, but as the report itself notes, the estimate for this age group should be approached with extreme caution, as assessing the preparedness of workers this far from retirement is extremely difficult, and the low estimate is largely the product of the disproportionately low savings target set for this group by the Fidelity Investments savings benchmarks that NIRS uses. Some factors likely result in this study’s findings being potentially somewhat pessimistic. First, the income replacement rate target used—85 percent—is at the high end of standard replacement rate recommendations. Second, the use of a single target rate for all households does not take into account that households with different characteristics may require different replacement rates. Finally, the use of a single schedule of savings targets at each age to measure whether households are on track does not account for the fact that households could potentially use different saving pathways and still end up with the same amount of money in retirement. It is important to note, however, that a number of these methodological choices, such as using a single target income replacement rate, are not unique to the NIRS analysis and, indeed, are used in numerous other assessments of retirement preparedness as well. Additionally, in follow-up publications, NIRS has shown that even when using more conservative savings targets, the share of households it finds to be at risk remains very high. Furthermore, it has illustrated that while savings pathways that backload savings into a worker’s later years may also be capable of achieving similar wealth targets at retirement, they can often be extremely difficult to realistically pursue. Overall, the estimate that 65 percent of American households are at risk is potentially pessimistic and represents a higher-end estimate of the share of the American population that may fall short in retirement. That being said, the NIRS analysis is useful for illustrating in transparent and easy-to-understand terms how American households stack up against the very standards—those put forward by industry professionals—they will likely be using to assess their own retirement preparedness. Additionally, its findings underscore the fact that retirement preparedness is generally getting worse among younger households. The optimistic assessmentsAt the other end of the spectrum is a group of studies that uses more complex modeling and that is more frequently cited by those who take a more optimistic view of the retirement crisis’ severity. These studies’ results generally paint a somewhat less negative picture than do the results of similar studies conducted by organizations such as the Center for Retirement Research, discussed below, due to their adoption of alternative assumptions about household consumption patterns and their preference for alternative measures of preretirement income. Most important, however, is that despite their adoption of these alternative assumptions and measures—the validities of which are still very much in contention—these best-case-scenario analyses still indicate that an unacceptably large share of American households may be forced to lower their standard of living in retirement and that the problem is growing over time. Among the primary studies often cited by those seeking to paint a more optimistic picture of Americans’ retirement preparedness is a 2012 study by Barbara A. Butrica, Karen E. Smith, and Howard M. Iams that uses a microsimulation model—the Modeling Income in the Near Term, or MINT, model, which is maintained by the Social Security Administration—to calculate to what extent individual households will be able to replace their preretirement incomes in retirement. While not calculating what share of each generation is at risk per se, the study provides a distribution of projected replacement rates for five generations of workers. The numbers often cited from this study are the seemingly impressive median replacement rates calculated for each generation, which range from 84 percent to 98 percent when using the preferable wage-adjusted measure of lifetime earnings (see text box on the next page) and from 109 percent to 119 percent when using price-adjusted earnings that are less appropriate for determining whether a worker will be able to maintain his or her standard of living in retirement. Why use wage indexing over price indexing?When calculating what percentage of an individual’s preretirement income will be replaced in retirement, a key part of the calculation is the measure of preretirement income used. Many studies use an average of a worker’s lifetime earnings, but the question then becomes whether previous years’ incomes should be adjusted using a price index or a wage index. An easy way to think of the differences between using either option is to imagine if a worker’s retirement income target were hypothetically determined using only an average of their first and last years of earnings. For the purposes of this example, let’s say a worker’s first year of earnings was 1973; her last year was 2013; and that in both years she earned exactly the median income, meaning that she was firmly in the middle class. Putting this worker’s 1973 income into 2013 dollars using a price index would only tell us how much money she would need today to purchase the same bundle of goods she could afford in 1973. While that bundle of goods was associated with a middle-class standard of living that year, the U.S. economy has grown significantly since then, above and beyond price inflation. This is due to increases in productivity, meaning that today’s middle-class standard of living is much improved from what was considered middle class just four decades ago. Consequently, if this worker’s price-adjusted 1973 income were simply averaged with her 2013 income and used to set her retirement income target, this would effectively be saying that she should significantly slash her current levels of consumption and adopt a lower standard of living that is somewhere between what was considered middle class four decades ago and what is considered middle class today. Using a wage index to adjust her 1973 earnings, however, would tell us how much money she would need today to afford the same relative level of consumption she enjoyed 40 years ago. In other words, since she was earning a middle-class income by 1973 standards, it would tell us what income she would need today to continue being middle class. If this figure and her 2013 income were used to set her retirement income target, it would result in the use of a target that truly attempted to maintain the standard of living she actually experienced over her lifetime—that of a middle-class American—as opposed to a standard of living based on how much she consumed in absolute terms decades earlier. Of course, the models actually used to determine replacement rates for current workers do not use only two years’ incomes, but the same logic applies when adjusting all of a worker’s past earnings. While price indexing certainly has a role in certain academic research, for the reasons outlined above, we believe that using wage indexing provides estimates of retirement needs that are far more reflective of workers’ standards of living in the long run. More important, however, is what the Butrica, Smith, and Iams study shows about the share of workers likely to fall short in retirement. When using wage-indexed lifetime earnings, the share of workers projected to have income replacement rates below 75 percent—a reasonable approximation of the minimum recommendations of most academics and industry professionals—ranges from 34 percent of the War Baby cohort, or those born between 1936 and 1945, to a full 43 percent of Gen Xers, or those born between 1966 and 1975. The share of workers projected to have replacement rates below 50 percent ranges from 13 percent of older workers all the way up to 18 percent of the youngest workers. In other words, the study shows that depending on the generation examined, between three and four out of every 10 workers will potentially have to lower their standard of living in retirement, and nearly one out of every five of the youngest workers may have to cut their consumption severely.
A second study often cited by more optimistic assessments of the retirement crisis is one by William G. Gale, John Karl Scholz, and Ananth Seshadri. This study differs from more pessimistic analyses in its use of alternative assumptions about how children leaving the home affects household consumption and to what extent retirees will continue to reduce their consumption in their later years beyond the amount by which they reduce it when they first enter retirement. (see text box on the next page) It also uses data on current retirees instead of data on current workers to gauge the share of Americans falling short in retirement. While the original paper published by Scholz, Seshadri, and Surachai Khitatrakun in 2006 used 1992 data to estimate the share of the so-called Health and Retirement Study, or HRS, cohort—those born between 1931 and 1941—falling below their optimal wealth targets, a 2009 working paper update written with Gale provides preliminary estimates for three additional cohorts using 2004 data. The most notable figure from this update is that 25.9 percent of the total sample was found to have insufficient assets, with the median shortfall faced standing at $32,260 in 2004 dollars. While this estimate does at first appear to be significantly lower than those produced by other sources, it still speaks to the existence of a significant retirement savings shortfall that will affect millions of American families. If the study by Gale, Scholz, and Seshadri represents a best-case scenario, than that best-case scenario is that more than one out of every four retired people examined had insufficient retirement income to maintain their standard of living. Significantly, this estimate was produced using data from before the onset of the Great Recession, which wreaked havoc on Americans’ savings and net worth. Furthermore, although this study does not look at current workers, the results show that the share of Americans at risk is growing with each successive generation of past retirees. Again, this indicates that the problem is becoming worse over time. Saying that this does not constitute a retirement crisis would be similar to saying the country would not be facing a housing crisis if one out of every four American families were found to be in danger of losing their home and that share was only projected to grow over time. Assumptions concerning household consumption, children, and agingAt the heart of the differences between the models used by researchers such as Gale, Scholz, and Seshadri and those used by organizations such as the CRR are differing assumptions concerning how household consumption changes over time. First, whether or not households are assumed to decrease their consumption after children move out of the home can significantly affect estimates of the share of households at risk. This is because if households do decrease their consumption, they can save more and will have a lower level of average consumption to replace in retirement, both of which will result in their appearing better prepared for retirement. If parents simply shift the expenditures they were making on their children to other forms of consumption—for example, while raising children they made financial sacrifices that only temporarily reduced their standard of living—they will continue saving at their previous rates and will need additional assets in retirement to maintain their current level of consumption. Studies such the one by Gale, Scholz, and Seshadri adopt the former assumption, while analyses by organizations such as the CRR adopt the latter. Second, while almost all analyses assume that households will initially lower their level of consumption when they first enter retirement (see Appendix), whether or not households accept gradual decreases in their level of consumption as they move through retirement beyond this initial drop-off also significantly impacts the share of households appearing at risk. This is simply because if retirees are consuming less in total, they will need to have accumulated fewer assets to fund this consumption. Studies such as the one by Gale, Scholz, and Seshadri do assume that retirees will reduce their consumption willingly over time beyond the initial decrease they experience when they first retire, while models such as the one used by the CRR generally assume retirees will maintain a constant level of consumption throughout retirement following the initial decrease. However, as Alicia H. Munnell, Matthew S. Rutledge, and Anthony Webb of the CRR make clear in a recent paper, what is extremely important about all of these assumptions is that they remain unsettled in the academic literature. For example, while some studies do show consumption gradually declining during retirement, it is unclear to what extent this is a product of declining consumption needs versus declining retirement incomes. There is also no preponderance of evidence that shows that households cut expenditures after children leave the home; while some studies show that households can and do cut consumption, others find the opposite. Moreover, there is significant debate over how much money future retirees will have to spend on health care and long-term care, and higher anticipated expenditures in these categories could significantly affect projected spending needs. (see Appendix) Which of these assumptions researchers feel are more plausible will determine in part whether they gravitate toward more optimistic studies, more pessimistic studies, or those that fall in the middle. That said, as |
| 主题 | Economy |
| URL | https://www.americanprogress.org/issues/economy/reports/2015/01/26/105394/the-reality-of-the-retirement-crisis/ |
| 来源智库 | Center for American Progress (United States) |
| 资源类型 | 智库出版物 |
| 条目标识符 | http://119.78.100.153/handle/2XGU8XDN/435951 |
| 推荐引用方式 GB/T 7714 | Keith Miller,David Madland,Christian E. Weller. The Reality of the Retirement Crisis. 2015. |
| 条目包含的文件 | ||||||
| 文件名称/大小 | 资源类型 | 版本类型 | 开放类型 | 使用许可 | ||
| RetirementCrisis1.pd(520KB) | 智库出版物 | 限制开放 | CC BY-NC-SA | 浏览 | ||
除非特别说明,本系统中所有内容都受版权保护,并保留所有权利。